Sales Dashboard
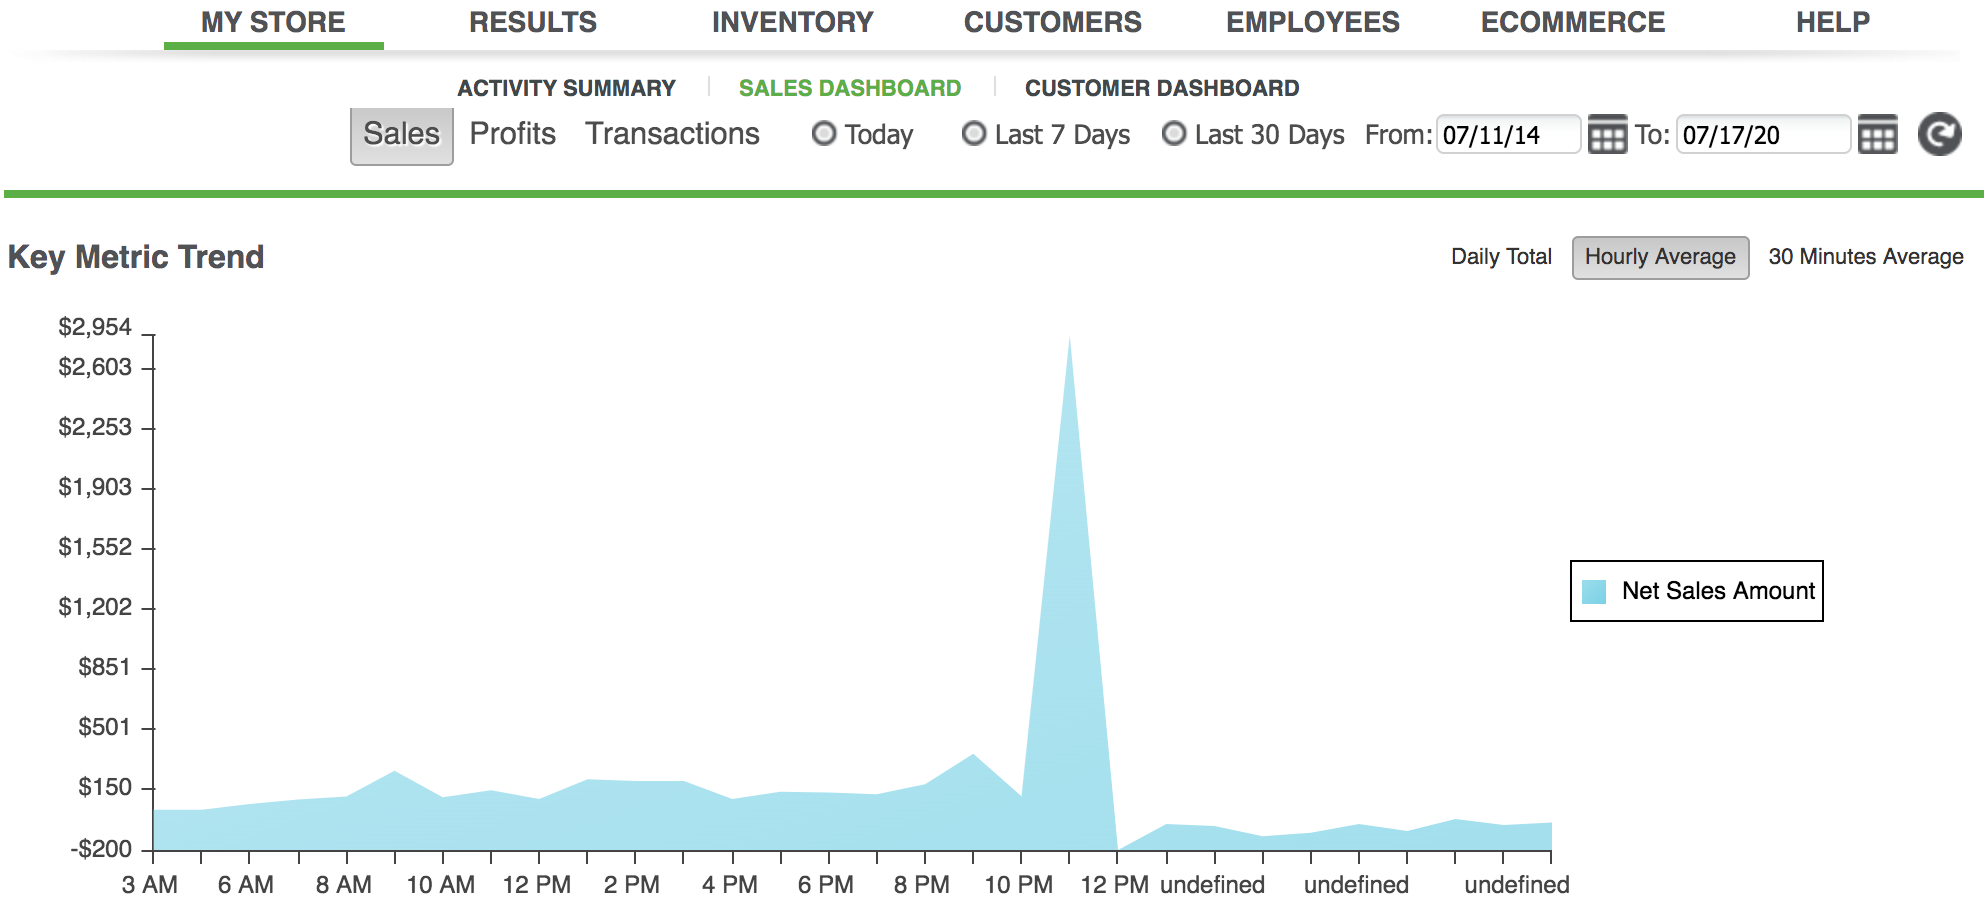
Click MY STORE > SALES DASHBOARD to see a real-time snapshot of your business. The graphs you see will depend on the option (Sales, Profits, or Transactions) you select at the top of the screen. This screen is made up of three major sections:
-
Key Metric Trend - view by Daily Total, Hourly Average or Hourly Average. You can choose from one of the default timeframes or enter a specific timeframe and click  . The Y-axis represents the metric chosen, and the X-axis represents time. You also have a choice of viewing by Daily Total, Hourly or Half Hourly Average using the buttons located in the top-right corner of the screen. The Daily Total displays data for entire days, the Hourly Average displays the typical results at a given hour, and the Half Hourly Average displays the results in 30-minute increments.