Questions?
Contact us at support line.
US: 877-270-3475
or
Log in to back office to chat with a representative
Contact us at support line.
US: 877-270-3475
or
Log in to back office to chat with a representative
Visit NCR.com/Silver
Browse by categories
Activity Summary, the first screen you see when you log in to Silver Back Office, provides a quick overview of your restaurant activity.
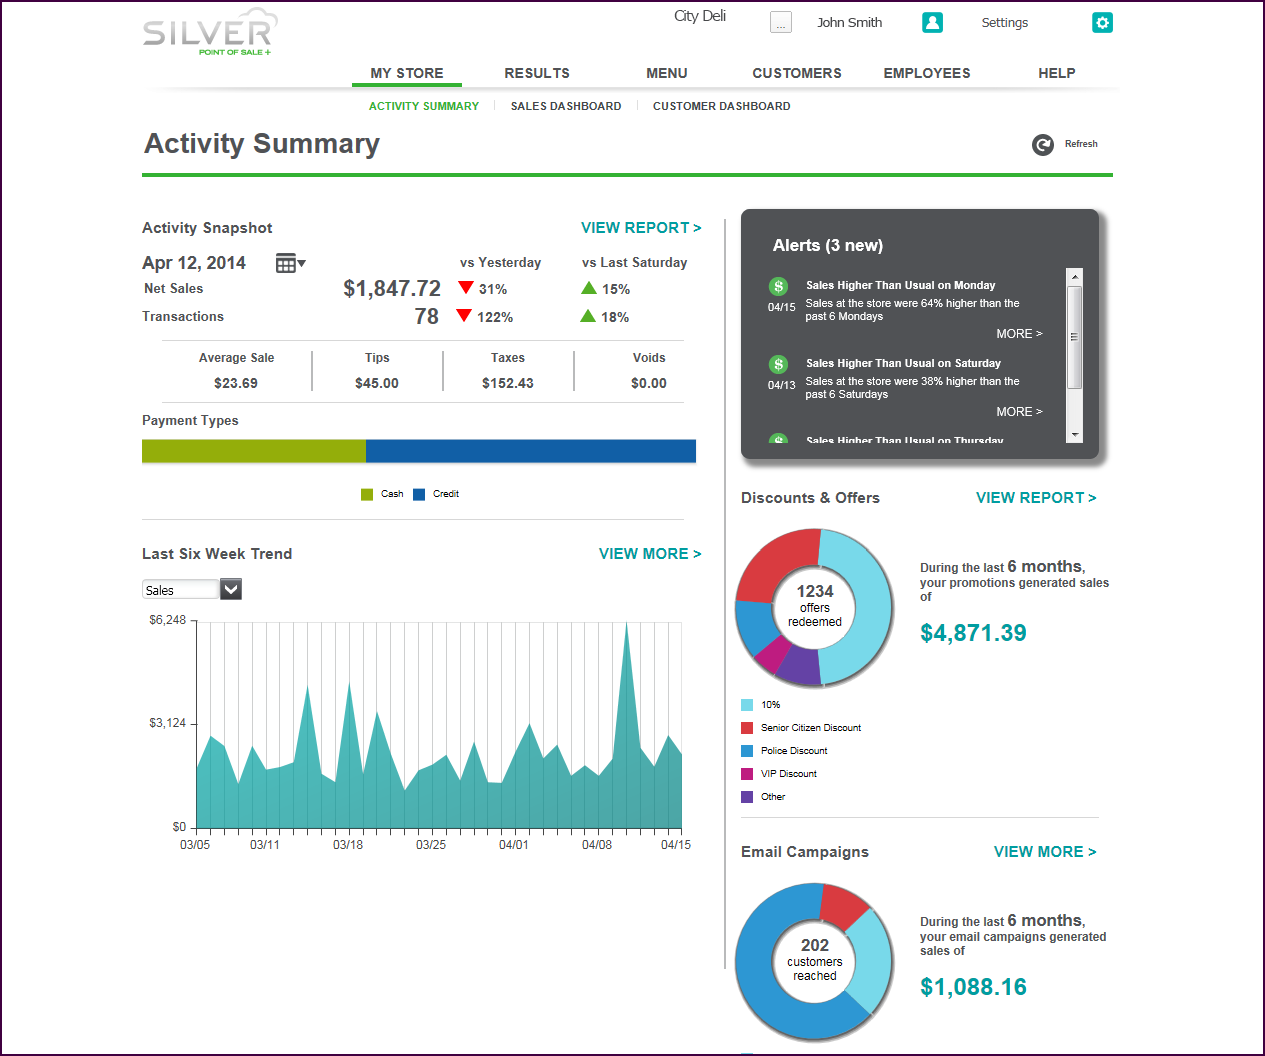
Activity Snapshot — Defaults to the current date and displays a visual snapshot of net sales and transactions. Compares the sales and transactions to the previous day and the same day of the previous week. You can also review the average sale, tips collected, taxes due, and the dollar amount of voids for the date selected. Activity Snapshot also provides a visual indication of cash payments compared to credit payments.
Last Six Week Trend — Displays a graphical trend of your sales or transactions for the previous six weeks.
Alerts — Notifies you of unusual sales activity within the previous seven days, such as higher than normal sales or higher than normal price overrides. Click More to see additional information on the alert.
Discounts & Offers — Provides a snapshot demonstrating the impact of your discounts and offers. See the number of offers redeemed, the sales generated, and the types of discounts and offers redeemed.
Email Campaigns — Provides a snapshot demonstrating the impact of your email marketing campaigns. See the number of customers reached, the sales generated, and the types of emails sent through your email marketing campaign.